piątek, 8 grudnia 2017

How to create dynamic OData query in Power BI?

Power BI allows you to import data from any service that exposes OData endpoint. You can either select "OData feed" in the "Get Data" window or go directly to Power Query editor and use OData.Feed function. Although documentation doesn't explain it clearly this function can operate in two different modes. You can pass either URL to the feed or complete OData query. The latter option is particularly interesting as it allows us to build dynamic queries, however, there is a price!

Let's start with a simple example that loads work items from Visual Studio Team Services using recently announced OData endpoint [2]. In the example I load all the work items that have been created in the last 7 days. Please notice that I use DateTimeZone.UtcNow function to get current date, subtract 7 days and convert it to the ISO 8601 format.

let
    since = DateTimeZone.UtcNow() - #duration(7, 0, 0, 0),
    Source = OData.Feed("https://stansw.analytics.visualstudio.com/_odata/WorkItems?" 
        & "$filter=CreatedDate lt " & DateTimeZone.ToText(since, "yyyy-MM-ddThh:mm:ssZ")
        & "&$select=WorkItemId, Title"),
    #"Removed Other Columns" = Table.SelectColumns(Source,{"WorkItemId", "Title"})
in
    #"Removed Other Columns"

This code will work great in Power BI Desktop, but when you publish it, you won't be able to schedule refresh, which defeats the purpose of publishing. Why would you share stale data?

The problem is with string concatenation. Power BI refuses to detect host for dynamic URL, thus, it cannot figure out which credentials should be applied to the dataset.

In order to fix it we need to switch to the other mode and use feed. This might not work for an arbitrarily complex OData query, but it should be sufficient for the majority of real-world queries.

This solution boils down to starting with feed and relying on Power Query feature called "folding" to translate function calls to the operations natively supported by the data source. In our case we are interested in functions Table.SelectRows and Table.SelectColumns which can be folded. Please notice that not every function can be folded! A good example is DateTimeZone.UtcNow which has to be called upfront and only its result can be passed to the filtering expression.

let
    since = DateTimeZone.UtcNow() - #duration(7, 0, 0, 0),
    Source = OData.Feed("https://stansw.analytics.visualstudio.com/_odata"),
    WorkItems_table = Source{[Name="WorkItems", Signature="table"]}[Data],
    #"Filter Rows" = Table.SelectRows(WorkItems_table, each [CreatedDate] < since),
    #"Select Columns" = Table.SelectColumns(#"Filter Rows",{"WorkItemId", "Title"})
in
    #"Select Columns"

During execution, this code will be translated to the following OData query, which is exactly what we wanted.

https://stansw.analytics.visualstudio.com/_odata/WorkItems?
  $filter=CreatedDate lt 2017-12-01T15:54:56.8747859Z
  &$select=WorkItemId,Title

If you publish the dataset to Power BI, the data source will be correctly detected and after you specify credentials you will be able to refresh the data and define a schedule.

I showed how to apply this solution to Visual Studio Team Services feed. It is, however, general and will for your feeds as well.

References

  1. Power Query M function reference - OData.Feed
  2. VSTS Analytics OData now publicly available
  3. Date and time format - ISO 8601

czwartek, 7 grudnia 2017

Syntax highlighting for DAX

I'm not sure if you noticed it, but one of my previous posts had code snippet in DAX and apart from being nicely formatted with Dax Formatter the syntax was highlighed as well. In order to create that snippet I added DAX support to the amazing library highlight.js I use to build my blog.

With this contribution you can format your DAX code as well.

MaxLength =
VAR Separator = "; "
RETURN
    MAXX (
        'Work Items - Today',
        1 + LEN ( [Tags] )
            - LEN ( SUBSTITUTE ( [Tags], Separator, "" ) )
    )

The pull request to the main project is still pending so you might need to cherry-pick my commit and build it.

https://github.com/isagalaev/highlight.js/pull/1560

Apart from adding it to the main project, I've also contributed it to the fork which is used by Microsoft in their documentation pipeline. Using this fork is another option you have to enable this feature in your websites.

https://github.com/DuncanmaMSFT/highlight.js

Hopefully all pull request will be completed soon and everyone will be able to use it by default.

References:

  1. It is not overengineering! - How to filter multivalued column in Power BI?
  2. DAX Formatter
  3. highlight.js

sobota, 22 lipca 2017

How to migrate VSTS reports from Excel to Power BI?

Disclaimer: I'm the author of the Open in Power BI extension.

If you are using Visual Studio Team Services and you want to see the status of the project in a form of reports in Power BI you are probably using great VSTS Open in Excel extension that was available for years now. It allows you to load results of your queries into Excel. It has been very popular among Power BI enthusiasts because of the great integration between Power BI and Excel.

I've talked to many people who setup elaborate data pipelines which pump data from VSTS into Excel and then into Power BI Service so that it can power the reach reports. The most typical problem with this approach is how to trigger data refresh operation. Power BI can handle refresh operations provided that you use one of the supported data sources. Unfortunately, as you can read in the "VSTS Open in Excel" extension page it requires "Visual Studio 2017" or "Team Foundation Server Office Integration 2017" to run. This makes it impossible to use directly in the Power BI Service. You can work around this problem by manually refreshing Excel workbook and publishing updated data. In this post I will briefly describe what Open in Power BI extension does and how it can help in such scenarios.

Official documentation describes this extension as:

Use this extension to create stunning reports in Power BI based on the Work Item Queries saved in Team Services. You can configure your reports to be refreshed daily to make sure your reports are always up to date. When you modify your Query by adding extra filters or columns these changes will be automatically reflected in Power BI upon next refresh.

What is particularly interesting is that with this extension you configure data refresh in Power BI Service. It is possible because it was build on top of Power Query functions, which are part of Visual Studio Team Services Power BI Data Connector [3]. These functions are available in the Service and in the Desktop since January 9 2017. Let's see how we can use it in our scenario.

Problem statement

Given existing report build on top of VSTS Open in Excel extension, migrate it to Open in Power BI, publish dataset to Power BI Service and configure refresh.

Solution

First let's look into how one could build a reporting pipeline on top of VSTS Open in Excel extension. As always, it all starts with a WIQL query. This time it is "Flat" query, which is a flat table of work items (I like to be creative with names).

Create reports based on "VSTS Open in Excel" extension

I can click "Open in Excel" button and the query result will appear in Excel. Please notice that columns have the right names and type - neat!

I don't need to make any changes here. I can simply save the spreadsheet locally and switch to Power BI Desktop to import the data.

I can do it by selecting Get Data and then Excel.

This will show me all the tables I can import. Please notice that there are 2 tables I can choose from: VSTS_e394e0b4... and Sheet1. It is because when you open a query in Excel the data is imported to a table embedded in a spreadsheet. You can refer to it in both ways but VSTS_e394e0b4... is a much better option. It will not only fetch the data but also metadata such as column names and types. As a result the Power Query code will be cleaner.

For my query this produced the following result. Column names were imported correctly, while types had to be set explicitly in code. This code was automatically generated and it got the types almost right because Tags is set to type any instead of type text. This column had no data, thus, Power BI failed to detect its type. I would need to manually set it to text if I wanted to perform some transformations later.

In order to make this migration more realistic I will customize the query. 
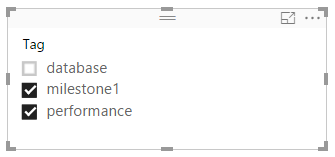
One of the popular customization I've seen in the past is splitting Area Path into multiple level columns. These columns make it easy to create roll-up reports. I've updated the Power Query code accordingly.

let
    Source = Excel.Workbook(File.Contents("C:\Sources\example.xlsx"), null, true),
    VSTS_e394e0b4_9fbb_4489_b0ea_f38c7103f8bb_Table = Source{[Item="VSTS_e394e0b4_9fbb_4489_b0ea_f38c7103f8bb",Kind="Table"]}[Data],
    #"Changed Type" = Table.TransformColumnTypes(VSTS_e394e0b4_9fbb_4489_b0ea_f38c7103f8bb_Table, {
        {"ID", Int64.Type}, 
        {"Work Item Type", type text}, 
        {"Title", type text}, 
        {"Assigned To", type text}, 
        {"State", type text}, 
        {"Tags", type any}, // Type detection failed for Tags!
        {"Area Path", type text}}),

    // -- Customization -------------------------------------------------------
    #"Split Column by Delimiter" = Table.SplitColumn(#"Changed Type","Area Path",
        Splitter.SplitTextByDelimiter("\", QuoteStyle.Csv),
        {"Area Path.1", "Area Path.2"}),
    #"Changed Type1" = Table.TransformColumnTypes(#"Split Column by Delimiter", {
        {"Area Path.1", type text}, 
        {"Area Path.2", type text}})
in
    #"Changed Type1"

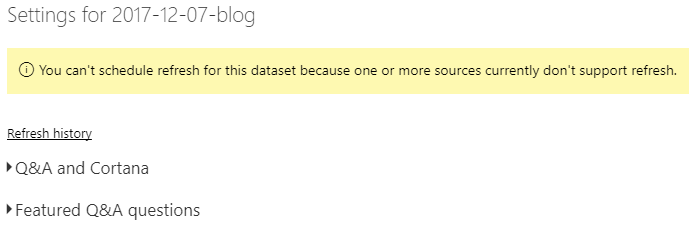
After loading the dataset I can publish it to Power BI Service, but there are some problems with scheduling refresh as you can see in the screen below.

First, you need to install Data Gateway because Power BI Service cannot access path C:\Sources\example.xlsx. It is also worth noticing that the gateway has to run on the same machine where the file is stored and you cannot move the file, otherwise the refresh operation will fail. Second, if you modify the query and add more columns, then they will not show up in the dataset. Finally, refresh will only fetch data that is already present in the spreadsheet. This means that unless you manually open Excel file and press Refresh button in the Team toolbar, you will end up with the stale data.

There are some workarounds such a saving workbook to SharePoint and scripting refresh operation, but they are more complicated than what an average user could set up.

Create reports based on "Open in Power BI" extension

Right now we should have a pretty good understanding of how one can use Excel to build reports in Power BI. Let's see how to achieve similar result with Open in Power BI extension.

Just as before I start with the query result page where I can find Open in Power BI button. This time, instead of opening intermediate app (Excel), it will launch Power BI Desktop straight away with a dataset ready to refresh.

When I open Query Editor I can immediately see some differences. Probably the biggest one is that there are 2 queries: Work Items and Functions. The latter is darker because it is not a table, it is a Power Query module that exports functions used in the other queries.

I will ignore Functions and look into how I can modify the Work Items query to apply the same customization as before. The query text is shorter and probably looks cleaner. It is divided into definition of parameters and then Functions[WiqlRunFlatQueryById]() is used to fetch a table. Column names and types are the same and I can use my old code directly. The only thing that I need to update is the name of the variable that is passed to Table.SplitColumn function. Previously it was Table.SplitColumn(#"Changed Type" and now it is Table.SplitColumn(Source. That's it, no other changes!

let
    url = "https://stansw.visualstudio.com", 
    project = "vsts-open-in-powerbi",
    id = "d5349265-9c9d-4808-933a-c3d27b731657",

    Source = Functions[WiqlRunFlatQueryById](url, [Project = project], id),

    // -- Customization -------------------------------------------------------
    #"Split Column by Delimiter" = Table.SplitColumn(Source,"Area Path",
        Splitter.SplitTextByDelimiter("\", QuoteStyle.Csv),
        {"Area Path.1", "Area Path.2"}),
    #"Changed Type1" = Table.TransformColumnTypes(#"Split Column by Delimiter", {
        {"Area Path.1", type text}, 
        {"Area Path.2", type text}})
in
    #"Changed Type1"

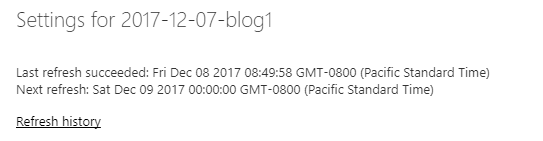
Now I can publish dataset to Power BI Service and inspect the settings page. First thing that I can notice is in the Gateway connection - Connect directly is the only available option. I do not need to install anything on my machine to get the refresh going!

Section Data source credentials is equally interesting. There is one entry Visual Studio Team Services. Because Open in Power BI extension is built on top of functions from the offial Data Connector, I can use standard authentication mechanism [3].

Finally I can expand Scheduled refresh section and define how often I want my dataset to be refreshed.

Conclusions

Open in Power BI extension was created with Power BI scenarios in mind, thus, it is much easier to use than building pipeline with VSTS Open in Excel. At the end of the day both solutions give me a table so any customization I create in Power Query for one solution, I will be able to easily move to another. The strongest advantage of Open in Power BI approach is that it works strainght away in Power BI Service without the gateway.

References:

  1. Visual Studio Team Services Marketplace - VSTS Open in Excel
  2. Visual Studio Team Services Marketplace - Open in Power BI
  3. Visual Studio Team Services - Functions available in Power BI Data Connector

niedziela, 2 lipca 2017

How to filter multivalued column in Power BI?

Recently someone asked me what is the best way to filter on a multi-valued columns in Power BI. The question was in the context of Tags property of the Work Items - Today table in the Visual Studio Team Services [1]. Although the original question was very specific, the solution I came up with can be generalized to multivalued columns in any data model.

What is a multivalued column?

Multivalued column is a database design pattern where instead of normalizing and splitting data across multiple tables you keep multiple values in a single table. You can see it typically in the data warehouses where normalization would lead to a too granular fact tables. One of the best examples is the Categories column in the Product table where want to allow users to select multiple values, but you don't want to create a separate Categories table.

In the context of Visual Studio Team Services there is one table where this pattern was applied - Work Items - Today. It contains Tags column which is a "; " delimited list of tags like in the example below.

Work Item Id Title Tags
1 Add column A to table B database; milestone1
2 Create migration script database
3 Improve performance of slow queries performance; database
... ... ...

Problem statement

Given table with a multivalued column prepare data model that will allow users to easily filter on distinct values.

For example, we can start with the table below, which has multivalued Tags column.

let
    Source = #table(
        {"Work Item Id", "Title", "Tags"},
        {
            { "1", "Add column A to table B", "database; milestone1" },
            { "2", "Create migration script", "database" },
            { "3", "Improve performance of slow queries", "performance; database" }
        })
in
    Source

If we simply selected Tags for the slicer it would produce the following result. Instead of values users could only select combinations that appear in the dataset. That's not what we want.

A much better design is to extract distinct values from the Tags column so that we can build the following slicer.

Solution

The solution I would like to show you is based on the post by SQLJason where he talks about handling delimited rows [2]. I modernized and improved it a little to cover columns of arbitrary length and to avoid contaminating model with auxiliary tables. The idea stays the same and can be broken down into the following steps.

  1. Create temporary index table.
  2. Apply CROSSJOIN operation and convert source table from wide to long format.
  3. Define relationships.

In my previous post "Creating index table in DAX" I explained how to create index table for a given N. Here, N should be selected as the max number of elements in the multivalued column.

MaxLength =
VAR Separator = "; "
RETURN
    MAXX (
        'Work Items - Today',
        1 + LEN ( [Tags] )
            - LEN ( SUBSTITUTE ( [Tags], Separator, "" ) )
    )

Now we can use this DAX expression and create Indexes table.

Indexes =
VAR Separator = "; "
RETURN
    FILTER (
        SUMMARIZE (
            ADDCOLUMNS (
                CALENDAR (
                    DATE ( 2000, 1, 1 ),
                    DATE ( 2000
                        + MAXX (
                            'Work Items - Today',
                            1 + LEN ( [Tags] )
                                - LEN ( SUBSTITUTE ( [Tags], Separator, "" ) )
                        ), 1, 1 )
                ),
                "Index", YEAR ( [Date] ) - 2000
            ),
            [Index]
        ),
        [Index] > 0
    )
Index
1
2
3

We do not need to store this table in our model. Instead, we can simply save it in the DAX variable and reuse later.

The final expression consists of the following operations:

  1. Save separator in the variable.
  2. Create index table.
  3. Add TagsCount to the Work Item - Today table to keep track of the index range.
  4. Apply CROSSJOIN with Indexes table.
  5. Filter out indexes that are outside of the range.
  6. Use PATHITEM to extract single value from the multivalued field by index and save it in Tag column.
  7. Summarize to reduce set of columns in the output table.
Tags =
VAR Separator = "; "
VAR Indexes =
    FILTER (
        SUMMARIZE (
            ADDCOLUMNS (
                CALENDAR (
                    DATE ( 2000, 1, 1 ),
                    DATE ( 2000
                        + MAXX (
                            'Work Items - Today',
                            1 + LEN ( [Tags] )
                                - LEN ( SUBSTITUTE ( [Tags], Separator, "" ) )
                        ), 1, 1 )
                ),
                "Index", YEAR ( [Date] ) - 2000
            ),
            [Index]
        ),
        [Index] > 0
    )
RETURN
    SUMMARIZE (
        ADDCOLUMNS (
            FILTER (
                CROSSJOIN (
                    ADDCOLUMNS (
                        'Work Items - Today',
                        "TagsCount", 1
                            + ( LEN ( [Tags] ) - LEN ( SUBSTITUTE ( [Tags], Separator, "" ) ) )
                                / LEN ( Separator )
                    ),
                    Indexes
                ),
                [Index] <= [TagsCount]
            ),
            "Tag", PATHITEM ( SUBSTITUTE ( [Tags], Separator, "|" ), [Index] )
        ),
        [Work Item Id],
        [Tag]
    )

It will produce the following result. This table captures relationship between work items and tags.

Work Item Id Tag
1 database
2 database
3 performance
1 milestone1
3 database

Now we need to define relationships and specify cross filtering direction. First, task is easy because most likely Power BI will automatically detect the relationship like in the example below.

The automatic relationship is a standard one-to-many relationship, which means that it will allow us to filter Tags based on Work Item - Taday selection. That is exactly opposite of what we need.

Double-click on the relationship to open the advanced editor and under "Cross filter direction" select "Both".

Finally, create a new slicer with Tag field from the newly created Tags table to get the best filtering experience! You can also try out amazing Smart Filter custom visual, which fits perfectly for this scenario.

References:

  1. Team Services & TFS - Available data tables in the Power BI Data Connector for Team Services
  2. Split a Delimited Row into Multiple Rows using DAX Queries
  3. It is not overengineering - Creating index table in DAX
  4. Custom visuals for Power BI - Smart Filter by OKViz
  5. SQLBI - Best Practices Using SUMMARIZE and ADDCOLUMNS
  6. Power BI Documentation - Calculated tables in Power BI Desktop

sobota, 1 lipca 2017

Creating index table in DAX

Sometimes, when you create advanced calculations in DAX, you need to create an auxiliary index table which contains increasing number like in the example below.

Index
1
2
...

There are several ways one can approach this problem. Marco Russo described some of them for the general case of creating static tables in his article [1]. Here I would like to present a different approach which works great for the more specific problem of index tables.

Problem statement

Create a table with one column where rows are increasing from 1 to 5.

Index
1
2
3
4
5

Solution

In Power BI we can create such table with Power Query or directly in DAX using calculated tables. In the first approach we would use List.Numbers function. Second, is more challenging as there is no such function in DAX. Luckily, there is CALENDAR function which can be used to generate a table!

IndexTable =
VAR Length = 5
VAR DummyDate = DATE ( 2000, 1, 1 )
RETURN
    CALENDAR ( DummyDate, DummyDate + Length )
Date
2000-01-01 00:00:00
2000-01-02 00:00:00
2000-01-03 00:00:00
2000-01-04 00:00:00
2000-01-05 00:00:00

Now we just need to clean it up by converting dates to numbers, adding new column, and removing the original column [4].

IndexTable =
VAR Length = 5
VAR DummyDate = DATE ( 2000, 1, 1 )
RETURN
    FILTER (
        SUMMARIZE (
            ADDCOLUMNS (
                CALENDAR ( DummyDate, DummyDate + Length ),
                "Index", INT ( [Date] ) - INT ( DummyDate )
            ),
            [Index]
        ),
        [Index] > 0
    )

References:

  1. Create Static Tables in DAX Using the DATATABLE Function
  2. Power Query M function reference - List.Numbers
  3. DAX Function Reference - CALENDAR
  4. Best Practices Using SUMMARIZE and ADDCOLUMNS
  5. Calculated tables in Power BI Desktop